The need for potassium
Potassium (K) is one of 17 nutrients that are essential for plant growth. Like nitrogen (N) and phosphorus, it is a macronutrient because plants require large amounts of K. Depending on the crop, the K requirement can be nearly as high as the N requirement. The following table shows the amount of K used by selected crops. Unlike most nutrients, most K is retained in the straw, or stems of crops. This means that relatively little K is removed each year with seed harvest, but large amounts of K are removed with the harvest of straw, and forage or green feed crops.
Table 1. K 2O* (lb./ac) taken up by various crops.
| Crop | Yield bu./ac. |
Grain lb. K 2 O/ac. |
Straw lb. K 2 O/ac. |
Total lb. K 2 O/ac. |
Total Uptake lb. K2O/bu. |
| Wheat | 40 | 16-19 | 49-61 | 65-80 | 1.63-2.00 |
| Barley | 80 | 23-28 | 73-89 | 96-117 | 1.20-1.46 |
| Oat | 100 | 17-20 | 114-140 | 131-160 | 1.3-1.6 |
| Corn | 100 | 26-30 | 91-111 | 116-141 | 1.2-1.4 |
| Canola | 35 | 16-20 | 57-69 | 73-89 | 2.10-2.54 |
| Flax | 24 | 13-16 | 26-32 | 39-48 | 1.63-2.00 |
| Pea | 50 | 32-39 | 91-111 | 123-150 | 2.46-3.00 |
| Lentil | 30 | 29-36 | 40-48 | 69-84 | 2.30-2.80 |
| Soybean | 30 | 41-42 | 31-90 | 72-132 | 2.4-4.4 |
| Faba bean | 85 | 60-70 | 80-120 | 140-190 | 1.7-2.4 |
| Grass | 1.5 | - | - | 59-72 | 39-48 lb. b.K2O/ton |
| Alfalfa | 2 tons | - | - | 108-132 | 54-66 lb. K2O/ton |
*The K content of fertilizers is expressed in the oxide form as K 2 O equivalent even though no K 2 O as such occurs in the fertilizer. The K 2 O designation is a standard expression of relative K content. Potash fertilizer (KCl) actually contains 51 per cent K, 47 per cent chloride (Cl) and two per cent iron and clays. To convert from K to K 2 O, multiply by 1.2, to convert K 2O to K multiply by 0.83.
Plants remove the ionic form of potassium (K +) from the soil. K plays more roles in a plant than any other nutrient. It does not become a direct part of the plant structure, but acts to regulate water balances, nutrient and sugar movement in plant tissue, plus drives starch and protein synthesis and legume nitrogen fixation.
The varied functions of K lead to a wide array of symptoms when deficient, such as:
- Slow growth
- Smaller, shriveled seed
- Poor water use efficiency
- Poorly developed root systems
- Frequent lodging
- Lower yields
- More susceptible to disease and to winterkill
- Poor N uptake
- Weak stems
Potassium is highly mobile within the plant. This implies the crop may move K from old leaves to new plant parts. A plant may be able to partly overcome an early K deficiency if the roots encounter better soil or fertilizer K supplies during the growing season. K deficiency symptoms appear first on older leaves. As deficiency increases, symptoms progress to the upper parts of the plant. Symptoms include browning or scorching on the leaf edges of cereal crops, and in spots across leaves of broadleaf crops.
The need for K in Saskatchewan
The total K content of Saskatchewan soils ranges from 100 to 50,000 lb./ac., depending on the parent material that formed the soil. However, usually less than two per cent of the total K is plant available.
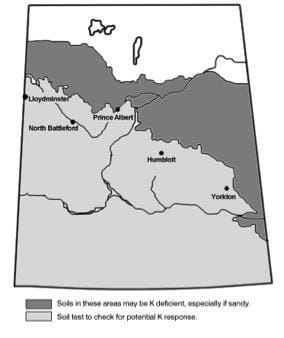
It is estimated that approximately one million acres are K deficient. The most severe deficiencies occur in the north and northeast, but K deficiency is possible in localized areas in all regions of the province (see map below). Sandy loam to loamy sand soils and peat soils are often K deficient. Fields where straw is continually removed should be monitored for K deficiencies. Forages harvested for hay also have high K removal rates, so forage fields need to be monitored.
Potassium deficiency can be complex. Soil tests can show adequate levels of available K, but crops will still respond to fertilization. Many factors interfere with crop uptake of K, including:
- Free lime in the rooting zone
- Cool soil temperatures
- Shallow rooting
- Poor drainage
- Soil compaction
K fertilizers
Application of Potash (KCI)
response in Saskatchewan
For lower rates, placement with the seed is often the best application method, since it is readily available to the plant. However, oilseed, pulse and forage crops have a fairly low tolerance to seed placed K, and seedling damage from the salt-effect can result from over application.
Higher levels of clay, organic matter and soil moisture increase the amount of fertilizer that can safely be applied with the seed.
Similarly, if more of the seedbed is utilized, more fertilizer can be applied.
For example, if the seeding implement has a 10 inch spacing that spreads the fertilizer over two inches, the Seedbed Utilization (SBU) will be (2/10 x 100 =) 20 per cent. A one inch spread on 10 inch spacing will have a SBU of (1/10 x 100 =) 10 per cent. The higher the SBU, the more fertilizer that can safely be applied with the seed provided seedbed moisture is good to excellent.
Where potassium fertilizer (K2O) is added with the seed, use the phosphorus safe rate guidelines. The total of phosphate (P2O5) plus potassium (K2O) should not exceed the maximum safe rate of seed placed phosphate (P2O5). This applies under good to excellent moisture conditions. See the Phosphorus fact sheet for a complete table of crops and safe rates of seed-placed P plus K.
Side-banding K as little as one inch below and one inch to the side of the seed or mid row banding, effectively separates seed and fertilizer to allow greater application rates.
Banding K in a separate operation with other fertilizers will also allow greater application rates.
Broadcasting and incorporating K prior to seeding can be an effective method of application, especially for vegetable, forage and other crops or soils that require high application rates. However, if K is broadcast and incorporated rather than banded, the application rate may need to be increased, especially if the K is top-dressed and not incorporated, depending on soil conditions. The differences between broadcasting and banding decrease as soil test K levels increase. Place at least 10 to 15 lb. K2O/ac. with the seed on very K deficient soils.
Response to K fertilizer
Saskatchewan researchers have studied K fertilization in field trials since 1949. Soils in the Gray and Black soil zones testing less than 210 lb./ac. of exchangeable available K in the top six inch of soil have been most responsive to K fertilization. However, isolated responses have occurred in other soil zones at higher soil test levels.
Except when K deficiency is severe, K fertilization will not result in a large crop response. Average yield increases are typically five to 10 per cent, although K fertilized field trials have shown as much as a 20 per cent increase over the unfertilized check.
In addition to yield response, improved grain quality (improved seed plumpness) may result from K fertilization.
Potassium requirements for various crops are shown in Table 2.
Table 2. Potassium recommendations (0 to 6 inch soil samples*) for Saskatchewan crops.**
| Soil Test | Cereals and Oilseeds | Barley and Pulses | Grass and Hay | Alfalfa and Clover |
| (lb. K/ac.) | lb./ac. of K20 to apply | |||
| -60 | 120-140 | 140-160 | 120-140 | 140-160 |
| 61-90 | 90-110 | 110-130 | 90-110 | 110-130 |
| 91-120 | 80-90 | 90-110 | 80-90 | 90-110 |
| 121-150 | 56-60 | 80-90 | 60-70 | 80-90 |
| 151-180 | 15-25 | 50-60 | 50-60 | 60-70 |
| 181-210 | 10-20 | 10-20 | 30-40 | 50-60 |
| 211-350 | 0 or 15*** | 0 or 15 *** | 0-30 | 40-50 |
* For 0 to 12 inch samples, multiply the 0 to 12 inch soil K level by 0.60 to convert to 0 to 6 inch samples.
To convert soil test lbs per acre in a 0-6 inch sample to ppm, multiply by 0.5.
To convert soil test lbs per acre in a 0-12 inch sample to ppm, multiply by 0.25.
*** Guideline only; responses in high potassium soils may be a result of physiological, environmental or disease effects.
Chloride Fertilization in Crop Production
Recent research found that annual canaryseed responds to chloride (Cl) as a fertilizer with an average yield increase of 25%.
The study indicates that when canaryseed is deficient in chloride other nutrients have very little impact on the grain yield of canaryseed. The impact of Cl on the grain yield and improved seed weight of canaryseed occurred during or after anthesis. A surface application of chloride, as potash (KCl), in the spring is an effective method in providing chloride fertilizer to the canaryseed if the potash can’t be side or midrow banded during seeding.